
Overview
Troubleshooting slow boots and logons are a common request. In this post I will show you how to perform boot logging using the Windows Performance Toolkit (WPT) on a Windows 7 machine and perform some basic analysis of it.
Preparation
First, you need to install the WPT on the machine you wish to examine.
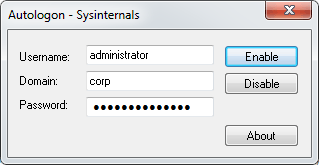
Secondly, we will be tracing the boot process all the way until the user has logged in and the desktop is shown. If we rely on quickly and manually logging in we introduce inconsistencies to any timings we do. The simplest solution is to use the Sysinternals Autologon tool available from the Sysinternals site and to configure it with the local or domain user we will be using for testing.
Performing the Boot Trace
-
- Logon to the machine as an administrative user.
- Use AutoLogon to setup the test user that will be used to automatically login during the trace. The test user need not be an administrator, but if not you will need to respond to any UAC prompts during the process to allow the tools to elevate to complete the trace.
- Create a local folder, for example C:\PerfTrace, to store the boot trace.
- Open an Administrator command prompt and change to the trace folder created above (cd C:\PerfTrace).
- Run the command:
xbootmgr -trace boot
- The machine will automatically shutdown, reboot and finally login.
- A “Delaying for boot trace” message will appear and the system will pause for 120 seconds to capture post-logon events.

- The tool will now elevate and a UAC consent box or prompt for credentials will appear.
- The trace will be completed and the trace files will be written into C:\PerfTrace\boot_BASE+CSWITCH_1.etl.

Analysing the Boot Trace
You can look at the boot trace in two main ways. The first way is to export the trace into XML which allows you to see the main timing points and the second is using the xperfview GUI.
Analysing using the XML Summary
To export the XML summary run the following command with the trace captured in the previous section:
xperf -i boot_BASE+CSWITCH_1.etl -o summary.xml -a boot

The resulting XML file can be opened in Internet Explorer (or your favourite XML editor). In order to expand and contract the individual nodes in IE you will need to allow active content by clicking on the yellow information warning box at the top of the screen. Contract all nodes apart from the those in the “timing” node to show the following view:
The two most immediately useful metrics are:
- bootDoneViaExplorer – Duration of the boot (in milliseconds) until the start of Explorer.exe
- bootDoneViaPostBoot – Length of the boot transition including PostBoot. This metric represents the total time of a boot transition.
In this example, bootDoneViaPostBoot would seem to indicate that the total boot time was 50 seconds (50094 millseconds). However, a boot trace waits for 10 seconds (postBootRequiredIdleTime) at the end of a boot until the system reaches an idle state. Therefore to get the actual total boot time we must subtract 10 seconds, in this example the adjusted boot time was 40 seconds.
Analysing using the xperfview GUI
To use a GUI to examine the boot trace open the trace in xperfview with the following command:
xperfview boot_BASE+CSWITCH_1.etl
There are many different views to look at in the xperfview GUI, but for this post we will concentrate on the main boot and logon processes (similar to the XML summary). Scroll down to the Winlogon section:

There are many different checkpoints here but some useful ones are:
- GP Client – This checkpoint occurs at a number of different points. Before the user logs in (Computer Group Policy) and after logon (User Group Policy). It is very useful to identify any GPO related problems.
- CreateSession Notification – This checkpoint occurs when the user enters their credentials and starts the logon process.
- Profiles – This checkpoint occurs when the user’s profile is being loaded.
- StartShell Notification – This is the last checkpoint when the shell is ready to load and explorer.exe is about to be launched. It corresponds to the WinlogonInit endTime entry from the XML summary.
Summary
This post showed how to perform boot logging using WPT at the most basic level. This can be a very complicated process and far too much to cover in a single post, future articles will go into more detail in individual areas.